-

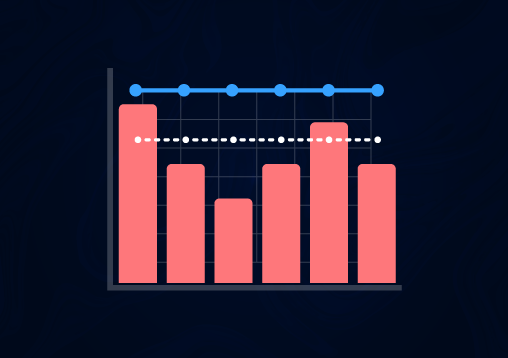
Every agile Team could benefit from the usage of a Burndown chart. Use it to track your effort and plan the delivery dates.
Try it!Free -
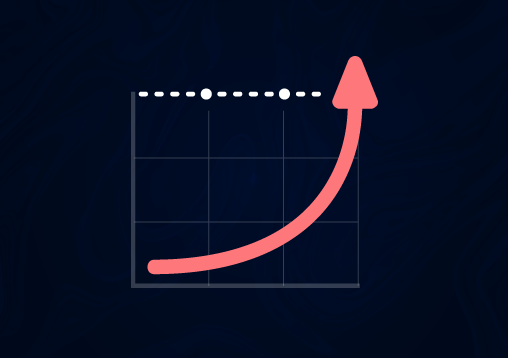
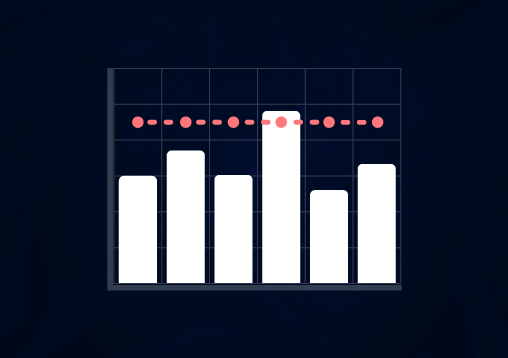
Like Burndown chart, Burnup will help you planning the delivery dates, but tracking completed tasks instead of remaining effort.
Try it!Free -
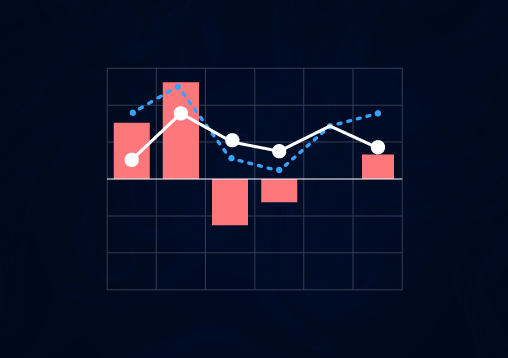
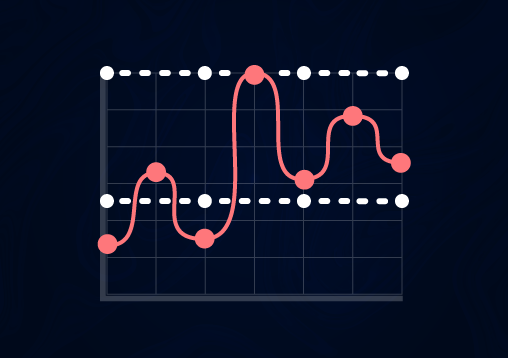
Are your estimations reliable? Accurate estimations will help you to plan accordingly and set your stakeholders expectations up.
Try it!Free -

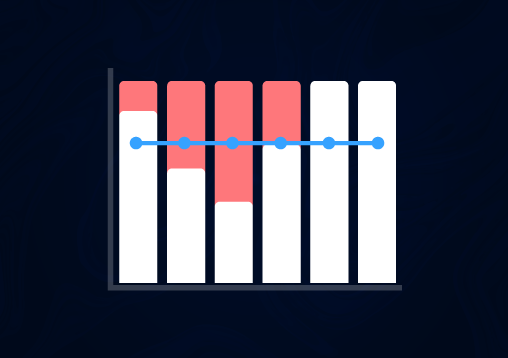
How restrictive is your “Definition of Done”? How often is your PO denying new features? If you can measure it, you can manage it.
Try it!Free -
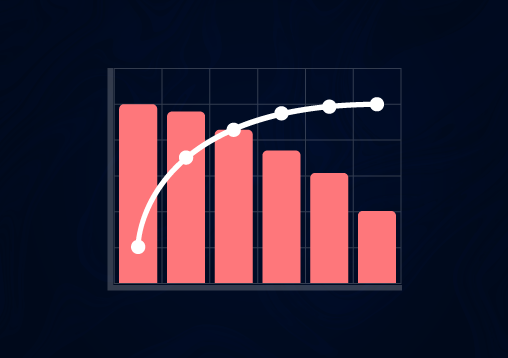
No one likes defects. But if there is something worse than development defects that is production defects. Control them.
Try it!Free -
The Key Quality Metric, it is flexible enough to resolve an infinite number of quality issues. A must-have in your metrics portfolio.
Try it!Free -
Are you prepared for your next sprint? This is the key indicator to guarantee readiness and avoid undesired surprises.
Try it!Free -
Velocity is the key metric you want to have in place if you are willing to track the performance of your Agile Team.
Try it!Free -
Velocity is important but stability is the long-term goal. Track fluctuation and determine root causes in performance valleys and spikes.
Try it!Free